
ACoS vs TACoS explained: the benchmarks sellers should hit
 By Monjur HossainFounder & Amazon Strategy Lead
·
Published
·
Last reviewed
·19 min read
By Monjur HossainFounder & Amazon Strategy Lead
·
Published
·
Last reviewed
·19 min read
ACoS vs TACoS comes down to the denominator. ACoS is ad spend divided by the sales those ads produced; TACoS is ad spend divided by total sales, organic included. ACoS tells you whether a campaign pays, TACoS whether the business is relying less on ads. Judge both against your own break-even, not a published average.
The two formulas, and why the difference matters
Spend $250 and generate $1,000 of advertised sales, and your ACoS is 25%. If total sales that month were $4,000 including organic, your TACoS is 6.25%. Same spend, two very different questions answered.
ACoS answers: is this campaign paying its way? It counts only sales Amazon attributes to an ad click inside the attribution window, which is why it never reconciles with your total revenue and why comparing it to anything other than your own break-even is close to meaningless.
TACoS answers: is the account getting healthier? Because the denominator includes organic sales, a falling TACoS at steady spend means organic revenue is growing underneath the advertising. That is the single best signal that your listing and keyword work is compounding rather than renting.
The failure mode of managing on ACoS alone is worth naming. Cutting bids will almost always lower ACoS, because you stop paying for the expensive marginal clicks. It will also lower sales velocity, which lowers organic rank, which lowers organic sales — and you will not see that in ACoS at all, because organic sales are not in the denominator. Accounts optimised to a beautiful ACoS have a habit of shrinking quietly.
Where ROAS fits
ROAS is the same relationship inverted: ad-attributed sales divided by ad spend. An ACoS of 25% is a ROAS of 4. Neither carries information the other lacks, so use whichever your team argues in and be consistent. The thing to avoid is a report that quotes ACoS in one section and ROAS in another, which reliably produces a meeting where nobody is comparing the same thing.
Nobody publishes a real benchmark. Including Amazon.
This is the part most articles skip, and it changes how you should read all of them.
Amazon does not publish ACoS or TACoS benchmarks. Its own guide states plainly that "there isn’t a definitive number for a good Amazon ACOS. It’s dependent on your industry, company size, and campaign frequency, among other variables". That is the platform owner, with all the data, declining to name a figure.
So every category table you have seen comes from an agency or a tool vendor reporting its own platform data. Those are not worthless, but they are samples of whoever happens to use that tool, with methodologies that are rarely disclosed and sample sizes that almost never are. And they disagree with each other by margins large enough to invert a decision:
- One widely-cited agency table puts apparel ACoS around 42%. Another puts the same category near 29%.
- Published category ranges across the better tables run from roughly 8% at the low end to 50% at the high end — a spread so wide that "your category averages X" carries almost no information.
- A tool vendor publishing a platform-wide average ACoS around 30% is describing its own customer base, not the marketplace.
If two independent sources disagree by fifteen percentage points on the same category, neither is a benchmark. They are two samples.
What to use instead
Amazon now gives you a real one, and almost nobody has turned it on. Benchmarks reporting went generally available worldwide on 18 May 2026, covering eight metrics for Brand Registry advertisers including click-through rate, cost per click and cost per purchase. Its Sponsored Brands companion is the one that gives you peer context directly: it reports your performance, ACoS included, against the category median, the lower-performing quartile and the top quartile.
That is your category, your window, Amazon’s own data. It beats any published average, and it is already in the console you are paying into.
The only number that actually matters: your break-even ACoS
Break-even ACoS is your contribution margin expressed as a percentage. Spend more than that on advertising and each advertised sale loses money; spend less and it makes money. It is arithmetic, not a benchmark, and it takes ten minutes.
Work down from the selling price:
| Line | Worked example |
|---|---|
| Selling price | $40.00 |
| Less Amazon referral fee (15% is common; the published range is 5% to 45% by category) | − $6.00 |
| Less FBA fulfilment fee | − $5.50 |
| Less cost of goods | − $9.00 |
| Less inbound shipping and duty | − $1.50 |
| Less returns and reimbursement allowance | − $1.00 |
| Contribution | $17.00 |
| Break-even ACoS = contribution ÷ price | 42.5% |
Referral fees vary widely by category — Amazon’s published schedule runs from 5% to 45% with a $0.30 minimum — so use your own rate rather than the 15% in this example. If you are VAT-registered and selling into the UK or EU, strip VAT from the price before you start; Amazon reports sales gross and the VAT portion was never yours.
Two things follow from having this number that do not follow from any benchmark.
It tells you who you are competing against. A brand on a 45% contribution margin can profitably outbid a brand on 20% all day. If your category is dominated by manufacturers and you are a reseller, the gap in break-even is the real story, not the gap in tactics.
It converts a target into a decision. "Is 32% ACoS good?" has no answer. "Is 32% below our 42.5% break-even?" has one, and it is yes, so the campaign is profitable and the question becomes whether to spend more.
Free calculator
Want your own break-even number?
Most sellers we speak to have never worked theirs out. Pop in your price, fees and cost of goods and you'll have it in about a minute.
Work out my break-evenWorking ranges by stage
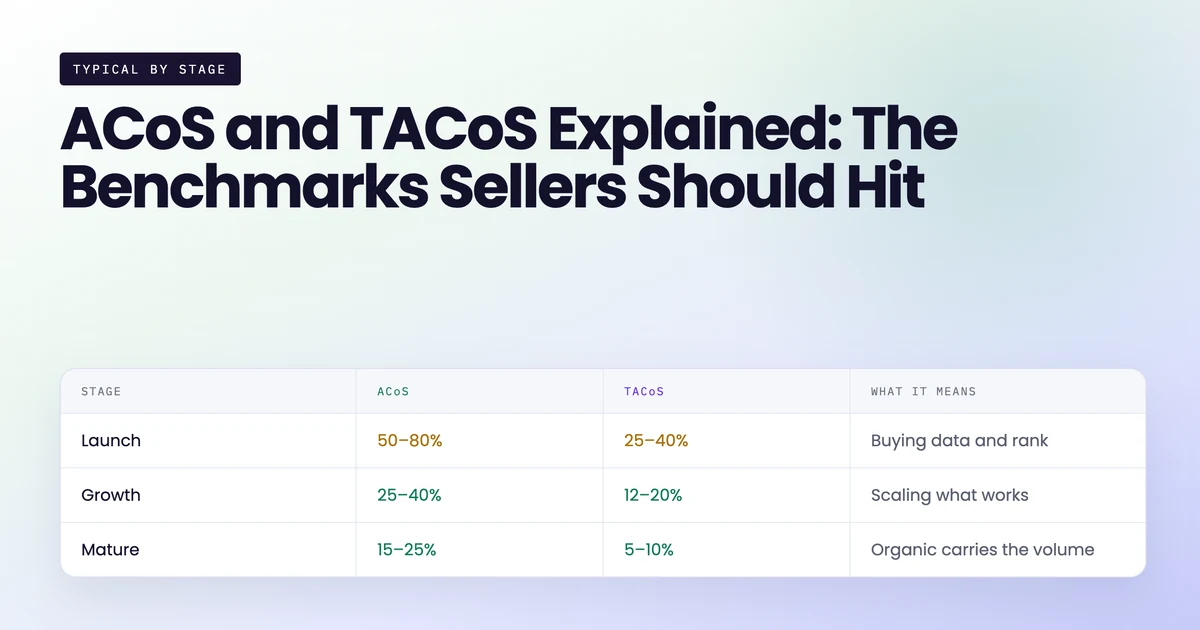
With the caveat above firmly in place — these are our own planning ranges, not published benchmarks — here is roughly where we expect an account to sit at each stage, and more importantly what each range means.
| Stage | ACoS | TACoS | What it means |
|---|---|---|---|
| Launch | 50–80% | 25–40% | Buying data and rank. Deliberately unprofitable |
| Growth | 25–40% | 12–20% | Scaling what the launch proved works |
| Mature | 15–25% | 5–10% | Organic carries the volume; ads defend and incrementally extend |
Read the TACoS column first. It is the one that tells a story: 25–40% at launch means most of your revenue is bought, 5–10% at maturity means most of it is earned. An account that has been running two years and still sits at 25% TACoS has not built anything — it is renting its position, and the rent goes up every year.
When a high ACoS is the right answer
Three situations, all of them deliberate.
Launch. You are buying sales velocity to establish relevance and rank on terms you intend to own organically. A 70% ACoS in month one that produces organic position on eight commercial terms is a good trade. The mistake is failing to define when it ends.
Defending a term you own. If a competitor is bidding on a keyword where you hold organic position one, conceding the paid slot above you costs more than the inflated ACoS of holding it.
Clearing stock. Storage fees and ageing inventory have their own cost. An ACoS above break-even on a product you need gone is not a loss, it is a cheaper exit than long-term storage.
When a low ACoS is a warning
A 6% ACoS almost always means bids are too low to win meaningful volume. It is profitable on nearly nothing, and it usually coexists with flat or falling total sales. If ACoS is excellent and revenue is not growing, you have optimised the ratio rather than the business.
It can also be an artefact. A very low ACoS on a brand-name campaign is mostly measuring people who were already going to buy from you, and reading it as advertising performance flatters the whole account. Split branded and non-branded reporting before you draw any conclusion from a number that looks too good, because a blended figure carried by branded traffic hides whatever the acquisition campaigns are really doing.
Reading the TACoS trend, which is where the money is
TACoS is only useful as a direction of travel. A single month’s figure tells you almost nothing; three months of it against stable spend tells you whether the account is compounding. There are four shapes it makes, and each one means something specific.
TACoS falling, total sales rising. The one you want. Organic revenue is growing faster than ad spend, which means the listing and keyword work is landing and advertising is doing less of the heavy lifting each month. When you see this, the correct response is usually to spend more, not less — you have found something that compounds and you are underfunding it.
TACoS falling, total sales flat. You cut spend and organic did not move. This looks like efficiency and is usually contraction: you have stopped buying marginal sales without replacing them. Check organic rank on your main terms before congratulating anyone.
TACoS rising, total sales rising. Growth bought with money. Legitimate during a launch, a new marketplace or a seasonal push, and a problem if it has been true for six months, because it means every increment of revenue costs more than the last and nothing is accumulating.
TACoS rising, total sales flat or falling. The alarm. Spend is going up and nothing is coming back. Almost always either a conversion problem on the detail page or a competitor who has entered the auction with a better margin than yours.
The measurement mistakes that waste the metric
Comparing across ASINs at different life stages. A launch product at 30% TACoS and a mature one at 7% are not comparable, and averaging them produces a number that describes neither. Track TACoS per product family, then roll up.
Reading it weekly. Attribution windows, restocks, promotional spikes and the ordinary lumpiness of retail all move a weekly figure far more than your management does. Monthly is the shortest honest period.
Forgetting that a price change moves it. TACoS has revenue in the denominator, so discounting raises it and a price increase lowers it, neither of which has anything to do with advertising. If you ran a coupon, say so in the report.
Amazon PPC management
Rather not watch these numbers every week?
That's the job we do for sellers: campaigns run against your break-even, with one honest monthly report on ACoS and TACoS.
See how we manage PPCWhy did your ACoS suddenly jump?
In rough order of likelihood, and each has a different fix.
Your conversion rate fell, not your ad efficiency. ACoS has two inputs and most people only look at one. If a competitor cut price, your reviews took a hit, you went out of stock on a variation, or your main image changed, the same clicks now produce fewer sales and ACoS rises without a single bid changing. Check conversion rate before you touch bids.
You lost the Featured Offer. Ads do not serve when you are not winning the Buy Box, and on a shared listing the spend can shift to whichever of your ASINs still is — usually a worse-converting one.
Seasonal competition. Cost per click is an auction, and in Q4 or during a Prime event the auction fills with advertisers who will accept a worse ratio than you. Your ACoS rising in the second week of November is not a campaign problem.
Automatic campaigns drifted. Without regular search term harvesting and negatives, auto campaigns spread into adjacent, poorly-converting queries. This is the most common cause in accounts nobody has touched for a quarter.
A new competitor entered. Someone launching in your category is running the 50–80% launch ACoS in the table above, and they are bidding against you with a budget that does not need to make sense yet.
The diagnostic order is: conversion rate, then Featured Offer, then search terms, then bids. Most people start at bids, which is the one lever that cannot fix any of the first three.
Two structural causes people miss entirely
Attribution shifting between campaigns. If you launched a Sponsored Brands or Sponsored Display campaign recently, some sales that Sponsored Products used to be credited with are now credited elsewhere. Sponsored Products ACoS rises, nothing has actually got worse, and the only way to see it is to look at blended performance across all campaign types rather than one line.
A change in placement mix. Top-of-search clicks cost meaningfully more than product page placements and convert differently. If your bid adjustments or the auction pushed a larger share of your impressions to top of search, your average cost per click rises and ACoS follows, without any change to your keywords or your listing. Check the placement report before concluding anything about targeting.
What to change, and in what order
Fix the detail page before the campaign. If conversion rate is the cause, no bid change recovers the ratio, it just buys fewer clicks at the same bad conversion. Then apply negatives to the search terms that spent without converting, which is almost always the cheapest single win available.
Then lower bids on keywords that convert but above break-even, rather than pausing them — pausing a term you rank for organically can cost you the rank as well as the paid position. Bid changes should be the last step and should move in increments of ten to fifteen percent, not halvings, because the auction needs a few days to settle before the new figure means anything.
Setting a target you can defend
A target ACoS is a business decision, not a marketing one, and it should be written down before the quarter rather than explained after it.
If you want profit now: target roughly 70–80% of break-even. On the 42.5% worked example above, that is 30–34%. It leaves genuine margin per advertised sale and accepts that you will not win every auction.
If you want growth: target break-even itself, and judge the quarter on total revenue and TACoS rather than on ACoS. You are converting margin into position on purpose.
If you are launching: ignore ACoS for the first thirty days entirely. Set a total budget you are willing to lose, watch organic rank on your target terms, and review at day 30. Our launch process treats the first month as data collection explicitly, because a launch judged on ACoS in week two always gets throttled before it has learned anything.
Review on a schedule, not on a feeling
Weekly: search term report, negatives applied, obvious bid corrections. Monthly: ACoS against target by campaign, and TACoS for the account. Quarterly: recalculate break-even, because fees and cost of goods move — Amazon raised FBA fees by an average $0.08 per unit from 15 January 2026, and announced no new FBA fee types. A break-even calculated before that date is now slightly wrong.
If you would like the arithmetic done against your actual numbers, our profit and break-even calculator is free and takes about a minute, and a written audit comes back within 48 hours with your targets set against your own margin rather than someone else’s category average.
ACoS vs TACoS: do the benchmarks differ by ad type?
Yes, and this is where most ACoS vs TACoS comparisons go wrong. Sponsored Products, Sponsored Brands and Sponsored Display do different jobs, are billed differently and get credit for sales over different windows, so one blended “good ACoS” across all three tells you very little. TACoS is the number that pulls them back together. (If the formats themselves are new to you, start with our Amazon ad types compared.)
Why Sponsored Brands and Display ACoS is not comparable with Sponsored Products
Sponsored Products sits right next to the shopper’s search and is paid per click, so its ACoS is the closest thing you have to the direct cost of a sale. Sponsored Brands and Sponsored Display work further up the funnel. They introduce the brand, retarget people who viewed a product, and can be bought per thousand viewable impressions (vCPM).
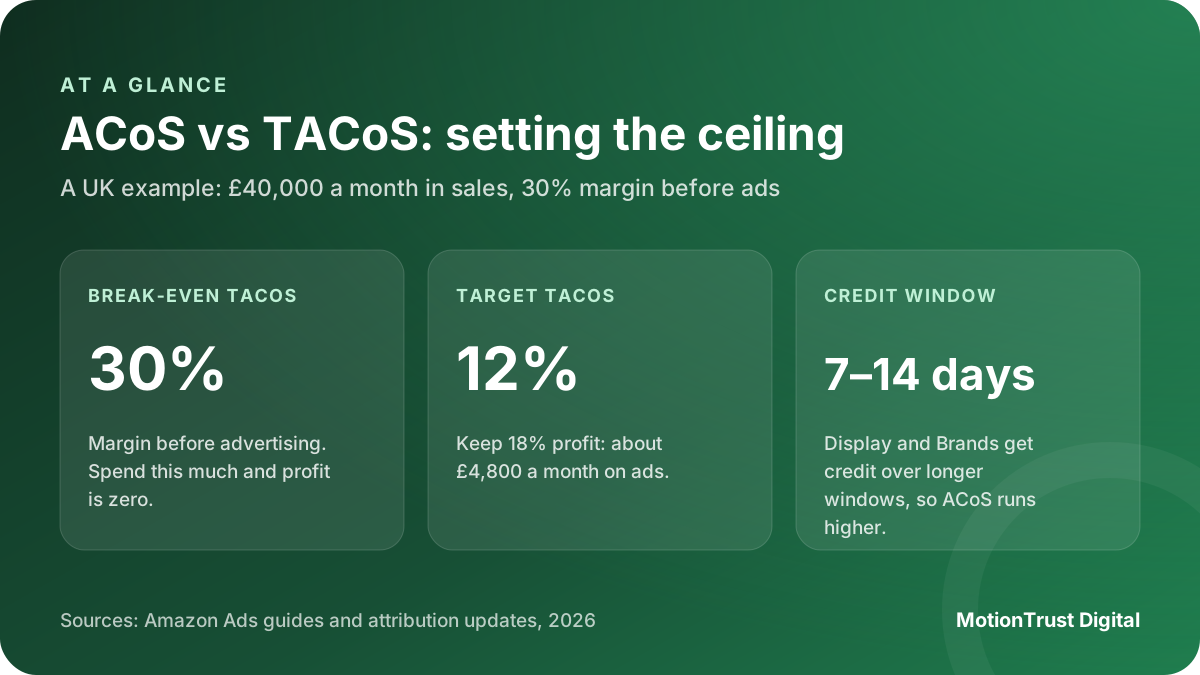
Amazon says display sales are credited over 7 to 14 days depending on the ad, and since January 2026 vCPM Sponsored Brands and Display campaigns count views over a 14-day window. A higher ACoS on those campaigns is expected. It is not a failure.
It is also why there is no reliable “average ACoS by category” to borrow. Amazon’s own guide says there is no definitive good ACoS, and Benchmarks reporting in the console compares you with similar advertisers rather than handing you a target.
ACoS vs TACoS: the right measure for each ad type
| Ad type | Main job | Judge it on |
|---|---|---|
| Sponsored Products | Catch searches that are ready to buy | ACoS against your break-even |
| Sponsored Brands | Win a shopper’s first order from the brand | New-to-brand share of orders |
| Sponsored Display | Retarget viewers and defend your product pages | Return over the 14-day window, then TACoS |
Break-even TACoS: the account-level ceiling
Break-even ACoS is your margin before advertising. Break-even TACoS uses the same margin but sets it against all sales, so it shows how much of total revenue the account can spend on ads before profit reaches zero. In the ACoS vs TACoS pairing this is the ceiling that matters. Your target TACoS is that margin minus the profit you want to keep.
A UK worked example in pounds
- Monthly sales: £40,000, organic and advertised together.
- Margin before advertising, after VAT, Amazon fees, FBA and landed cost: 30%, or £12,000.
- Break-even TACoS: 30%. Spending £12,000 on ads would leave nothing.
- Target profit of 18% gives a target TACoS of 12%: an ad budget of about £4,800 a month.
Inside that £4,800, Sponsored Products can run close to its break-even ACoS while Brands and Display run higher, as long as the account stays at or under 12% TACoS and the trend is falling. If TACoS climbs while total sales stay flat, the ads are taking credit for sales you would have had anyway, usually on your own brand name. A free PPC audit is the quickest way to spot that, and our Amazon PPC management team sets budgets by ad type against exactly this ceiling.
Free account review
Not sure what your targets should be?
Send us your account and a specialist will come back within 48 hours with ACoS and TACoS targets worked out from your own margin.
Get my free reviewQuestions people also ask
What's the difference between ACoS and TACoS?
ACoS measures ad spend against ad-attributed sales only. TACoS measures ad spend against total sales, organic included. ACoS tells you whether a campaign pays; TACoS tells you whether the account is becoming less dependent on advertising. A falling TACoS at steady spend is organic growth underneath the ads.
What is a good ACoS on Amazon?
Any figure below your break-even, which is your contribution margin after Amazon fees, cost of goods and shipping. There is no universal answer, and Amazon says so itself: its own guide states there is no definitive number for a good ACoS. A brand on a 45% margin can profitably run 30%; a brand on 20% cannot.
What is the average ACoS on Amazon in 2026?
No primary source publishes one. Every figure circulating comes from an agency or tool vendor reporting its own platform data, and the better tables disagree by fifteen percentage points or more on the same category. Use Amazon’s own Benchmarks reporting, generally available since 18 May 2026, and its Sponsored Brands companion report, which shows your performance against the category median and quartiles.
Is a 30% ACoS good?
Only relative to your break-even. On a $40 product with $17 of contribution, break-even is 42.5% and 30% is comfortably profitable. On a thinner margin where break-even is 24%, the same 30% loses money on every advertised sale.
What does a 20% ACoS mean?
That you spent $20 in advertising for every $100 of ad-attributed sales, so advertising consumed a fifth of that revenue before any other cost. Whether that is good depends entirely on what the other four fifths have to cover.
How do I calculate my break-even ACoS?
Start with your selling price and subtract the Amazon referral fee, the FBA fee, cost of goods, inbound shipping and a returns allowance. What remains is contribution. Contribution divided by selling price, as a percentage, is your break-even ACoS. If you are VAT-registered, strip VAT from the price first.
What ACoS should I target when launching a new product?
Do not target one for the first thirty days. Launch advertising buys sales velocity and relevance rather than immediate profit, and our own working range at that stage is 50 to 80% ACoS. Set a total budget you are willing to lose, watch organic rank on your target terms, and review at day 30.
How does ACoS vary by Amazon category?
Published tables suggest a spread from roughly 8% to 50%, but they disagree so widely on the same categories that the spread is not usable for planning. Category matters through its effect on your margin and your cost per click, both of which you can measure directly rather than infer from someone else’s sample.
Why did my ACoS suddenly increase?
Usually conversion rate rather than ad efficiency: a competitor cut price, reviews dipped, a variation went out of stock, or the main image changed. Then check whether you lost the Featured Offer, then whether automatic campaigns have drifted into poor search terms. Bids are the last thing to look at, not the first.
Is a lower ACoS always better on Amazon?
No. A very low ACoS usually means bids are too low to win meaningful volume — profitable on almost nothing. If ACoS is excellent and total revenue is flat, you have optimised the ratio rather than the business.
What does TACoS tell me that ACoS doesn't?
Whether organic sales are growing. Because TACoS divides ad spend by total sales, a falling TACoS at steady spend means revenue is increasingly coming from somewhere other than ads. ACoS cannot show you that, because organic sales are not in its denominator at all.
Should new product launches run higher ACoS?
Yes, deliberately and with an end date. You are buying the sales velocity that establishes relevance on terms you intend to hold organically. The mistake is not the high ACoS, it is failing to define when the launch phase stops and the growth target applies.
What's the relationship between ACoS and ROAS?
They are the same relationship inverted. ROAS is ad-attributed sales divided by ad spend, so an ACoS of 25% is a ROAS of 4. Neither carries information the other lacks — just pick one and use it consistently across your reporting.
What is a good TACoS on Amazon?
It depends on stage rather than category. Our own working ranges are 25 to 40% at launch, 12 to 20% while growing, and 5 to 10% for a mature product where organic carries the volume. The direction matters more than the level: falling TACoS at steady spend is the signal you want.
How do I calculate break-even TACoS?
Work out your margin before advertising: price minus VAT, Amazon fees, FBA and landed cost, as a percentage of sales. That percentage is your break-even TACoS. Total ad spend divided by total sales can rise to it before profit reaches zero. Subtract the profit you want to keep to get a target TACoS.
Should Sponsored Brands have the same ACoS target as Sponsored Products?
No. Sponsored Brands is mainly about winning new customers to the brand and is credited over a different window, so judge it on new-to-brand share and on the account’s TACoS. Keep the tight ACoS vs TACoS discipline for Sponsored Products, which captures ready-to-buy searches.
Written by Monjur Hossain, Founder & Amazon Strategy Lead at MotionTrust Digital, from the agency’s day-to-day work on client Amazon accounts and checked against the primary documentation listed under Sources below. Primary sources for this guide: Amazon Ads, Amazon and Amazon Selling Partners.
Every figure attributed to Amazon or to another named organisation links to that organisation’s own page, with the month it was accessed. Anything drawn from our own client accounts is labelled as ours rather than presented as an industry figure, and where no primary source publishes a number this guide says so instead of estimating one. Last reviewed .
- Amazon Ads — ACoS — advertising cost of sales, accessed September 2026.
- Amazon Ads — Benchmarks reporting, 18 May 2026, accessed September 2026.
- Amazon Ads — Sponsored Brands category benchmark report, accessed September 2026.
- Amazon — Selling fees and referral fee schedule, accessed September 2026.
- Amazon Selling Partners — 2026 US referral and FBA fee update, 15 October 2025, accessed September 2026.
- Amazon Ads — Your complete guide to Sponsored Brands, accessed October 2026.
- Amazon Ads — Everything you need to know about display ads, accessed October 2026.
- Amazon Ads — View attribution updates for Amazon Store ads (January 2026), accessed October 2026.
Monjur Hossain
Founder & Amazon Strategy Lead, MotionTrust Digital
Monjur incorporated MotionTrust Digital in September 2022 and leads Amazon strategy across the client base. Eight years in e-commerce and marketplace marketing, now on Amazon only — keyword strategy, listing architecture and advertising structure for growing brands.
MonjurAgency